Building Elasticsearch Analysis Inspector
on Elasticsearch, React, Web
 Try it out! Elasticsearch Analysis Inspector
I have been developing a new tool, the Elasticsearch Analysis Inspector. It was the result of a combination of curiosity, exploration, and a small desire to have something better to visualize and gain insights into the Elasticsearch analysis process.
Background
As part of the extensive Elasticsearch REST API, the analyze API endpoint provides insights into Elasticsearch tokenizers, character filters, and token filters. Analysis is a very critical aspect of Elasticsearch that is crucial to both indexing and querying in Elasticsearch. It is one of the tools that stands between users and despair at unanticipated behavior within Elasticsearch. As a result of such API endpoints, tools can provide a more visual window into key aspects such as analysis.
For a long time, Elasticsearch users could rely on the Elasticsearch Inquisitor to review how Elasticsearch analyzes any sample text given available analyzers and rudimentary custom analyzer definition. The tool also doubles to assist users in debugging queries. So then, why build another tool? Inquisitor is a great tool, a one-stop shop, that addresses the essentials for Elasticsearch users by providing insights into querying and analysis. However, I wanted something standalone that did not require users to have an Elasticsearch host on hand, something focused on analysis in Elasticsearch, and something that provided users with the finer control over analysis definitions with a better user experience.
Introducting Elasticsearch Analysis Inspector
Elasticsearch Analysis Inspector is dedicated to allowing users to define fine-grained control of analysis definitions and gain insights into the analysis process. It does so by providing a more intuitive UX, allowing users full control over defining analyzers, and focusing on the analysis aspect of Elasticsearch. On top of this, it brings users a multitude of conveniences that were previously unavailable.
Features and Highlights
While not limited to these features, these are some key features of the inspector that may stand out to you.
UI
The tool is powered by Elastic’s own EUI framework. It makes available a full suite of react components inspired by Elastic’s design philosophy. It is responsive and themable. It also strives to be accessible.
I initially started with material-ui. However, I had seen EUI, and thought it would be a nice change of pace. I found its aesthetics appealing and appreciated the clean and minimal feel. I also thought it was fitting that the tool use Elastic’s own design philosophy.
Editor
For simple and fast analyzer definition creation and updates, the inspector makes a friendly editor available.
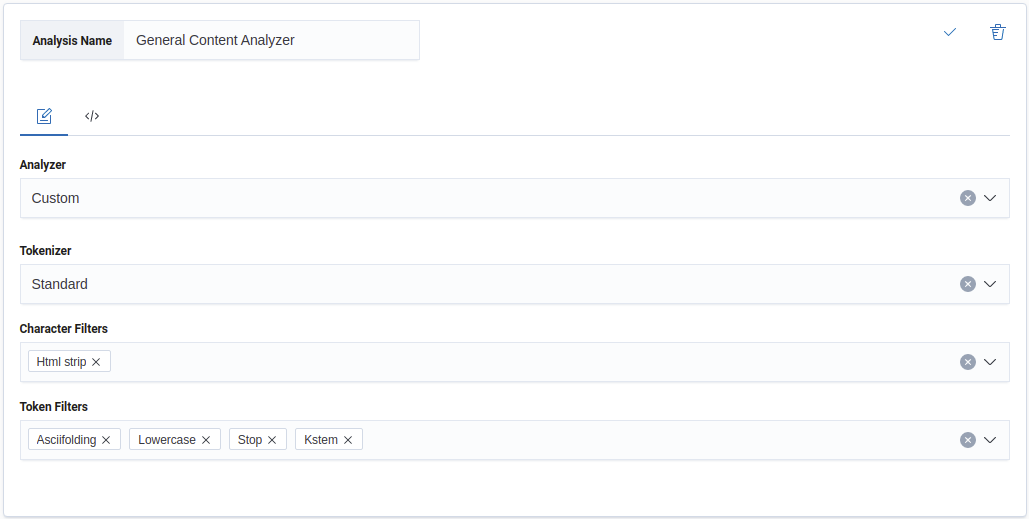
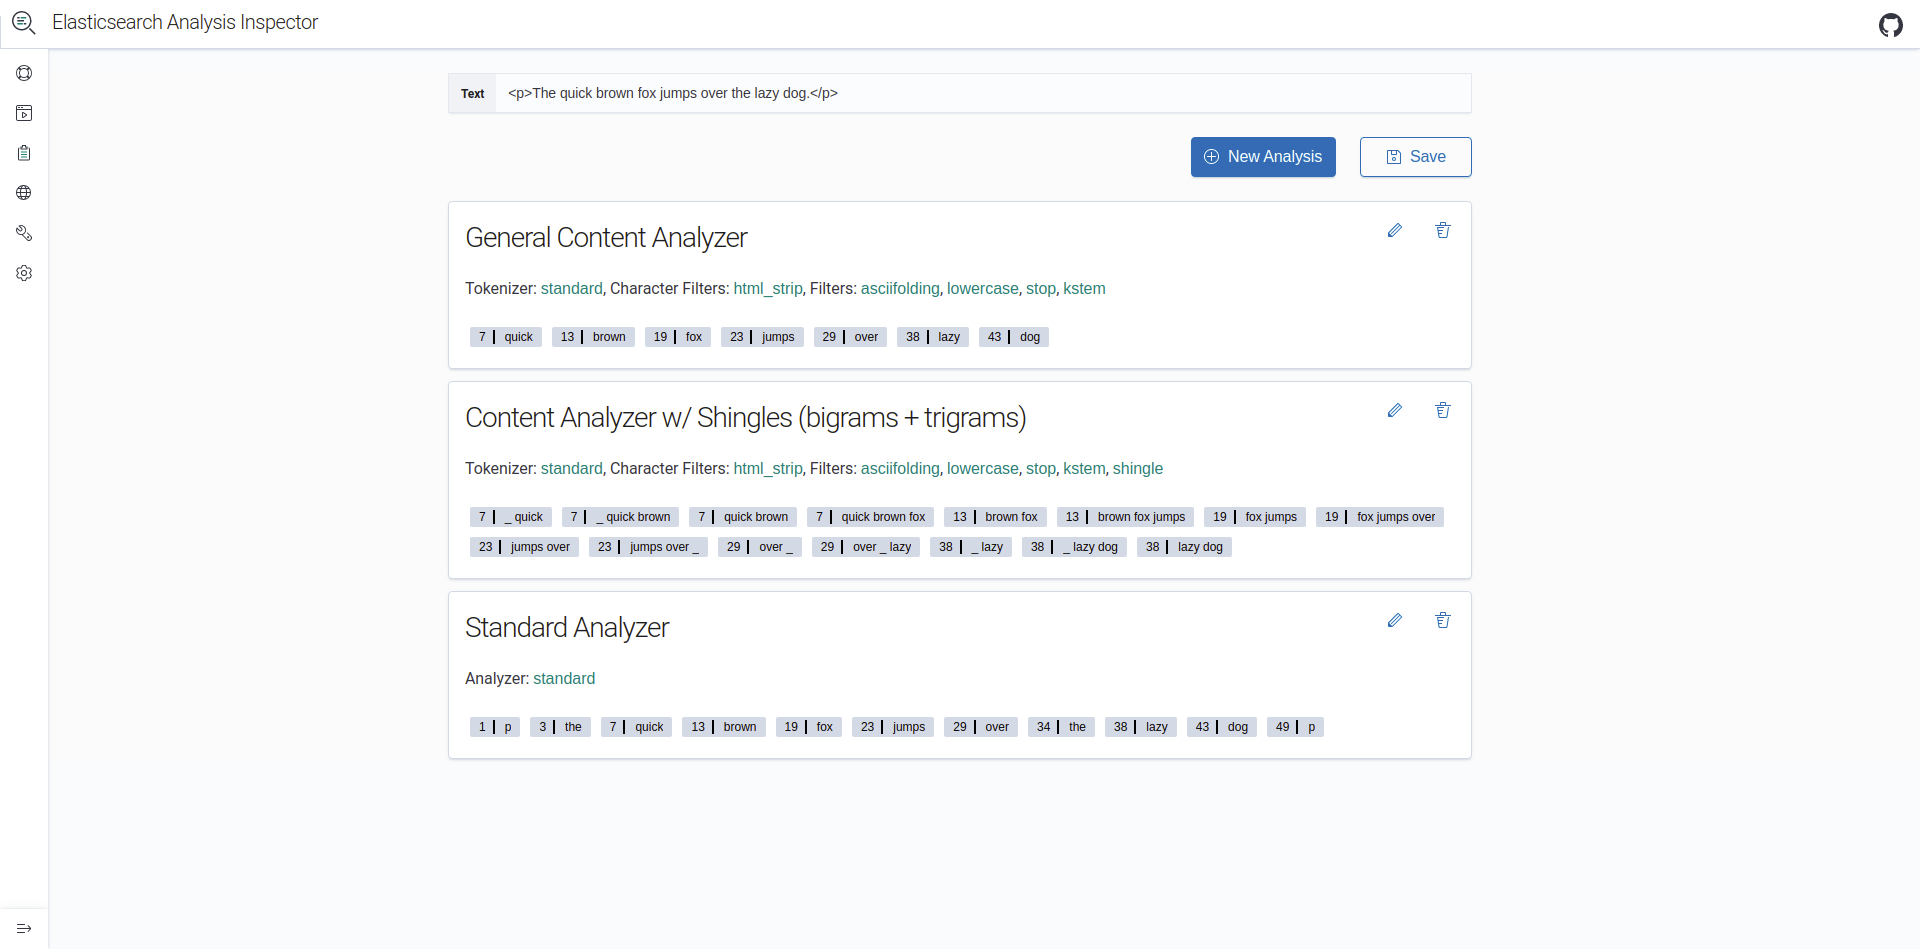
The friendly editor allows you to quickly select an analyzer from the base set that Elasticsearch makes available. If you choose to the custom analyzer, you may go on and select the tokenizer, character filters, and token filters that constitute your custom analyzer. These are the analyzer aspects that Elasticsearch also makes available without any custom user configuration.
Code Editor
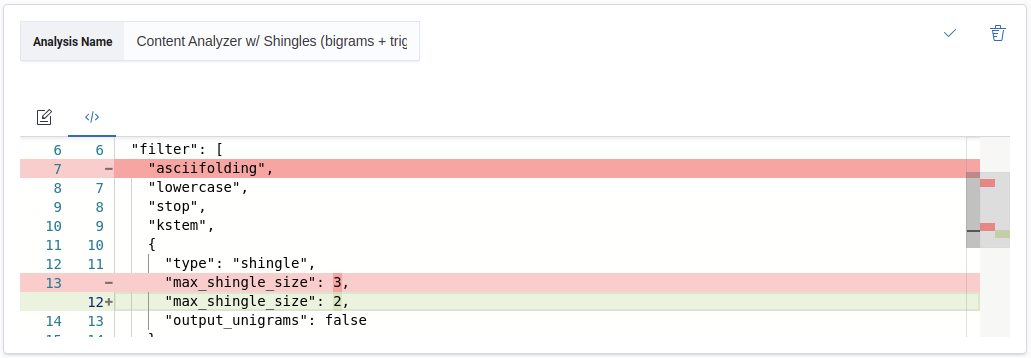
Of course, this may not be enough for quite a lot of what Elasticsearch has to offer when it comes to analysis:
- How might users define the regular expressions required for pattern filters?
- How do users set the number of shingles?
- How can users select the number of ngrams?
A code editor, as an alternative to the friendly editor, is available to allow users to specify these details.
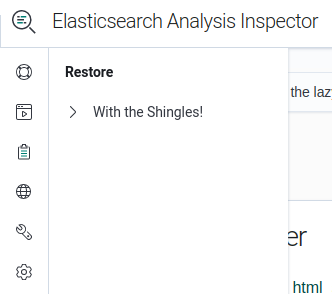
Share, Save, and Load
Since the inspector is publicly available and each configuration you come
up with has an unique url, you may share your creations easily by sharing the urls!
As a convenience, the inspector provides the option to save the definitions
users come up with to localStorage.
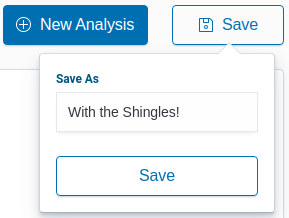
And whatever sets of definitions you save are available for retrieval later.
Elasticsearch Host
In order to create a tool to interface with Elasticsearch, we need a host that the tool can work with. As I hinted before, I wanted users to be able to test drive custom analyzer definitions without access to a host. This provides the following advantages:
- Users, without immediate access to a host, may quickly test drive analyzer definitions. For example, you may respond to a stackoverflow post without spinning up a host to simply review what analysis results look like.
- Users may easily share, reproduce, and observe identical analysis results easily.
Hosting and Security
I use Bonsai’s platform to have access to a free Elasticsearch host. The host comes with limitations on concurrent requests, number of records, etc. However, for the purposes of this application, none of these limitations are roadblocks for intended functionality.
Elasticsearch clusters should not be exposed and available for all to see. Since I did not want to worry about the cluster being compromised, I use a proxy that only allows requests against the analyze API endpoint of Elasticsearch.
Future Plans
To continue improving the usability of the tool, here are some potential additions you may see in the future:
- Users are able to see raw Elasticsearch responses.
- Users are able to see the impact that the Princeton Wordnet can have on analysis.
- Users may be able to download a chrome extension.